2024 Treatment Outcomes Summary: Patient-Reported Improvements Across Diagnostic Categories
This 2024 outcomes report highlights key changes in symptom severity, emotional functioning, and quality of life among patients receiving care across SunCloud Health’s adult residential and outpatient programs.
Using standardized, validated assessment tools, we measure change from admission to discharge across multiple diagnostic categories, including mood disorders, anxiety, PTSD, substance use, eating disorders, and food addiction.
As a center that specializes in treating individuals with complex, multi-diagnosis conditions, these results reflect our commitment to integrated, trauma-informed care that supports the whole person—not just a single diagnosis. These changes support the measurable effectiveness of our treatment model in delivering meaningful, sustained improvement across diverse areas of mental health.
Disclaimer: While average scores can be used to identify trends, they do not guarantee success for any one individual in treatment. We use these metrics to identify areas of improvement and as an additional data point to see how our patients are responding to treatment.
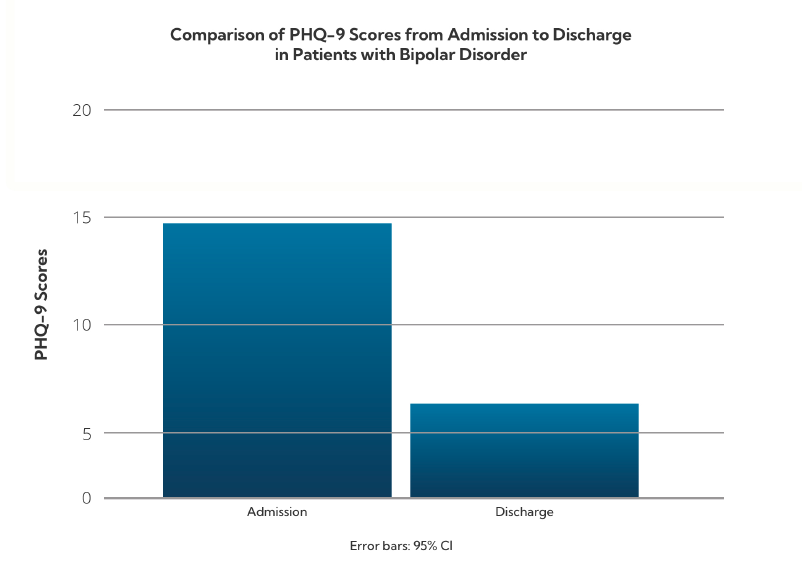
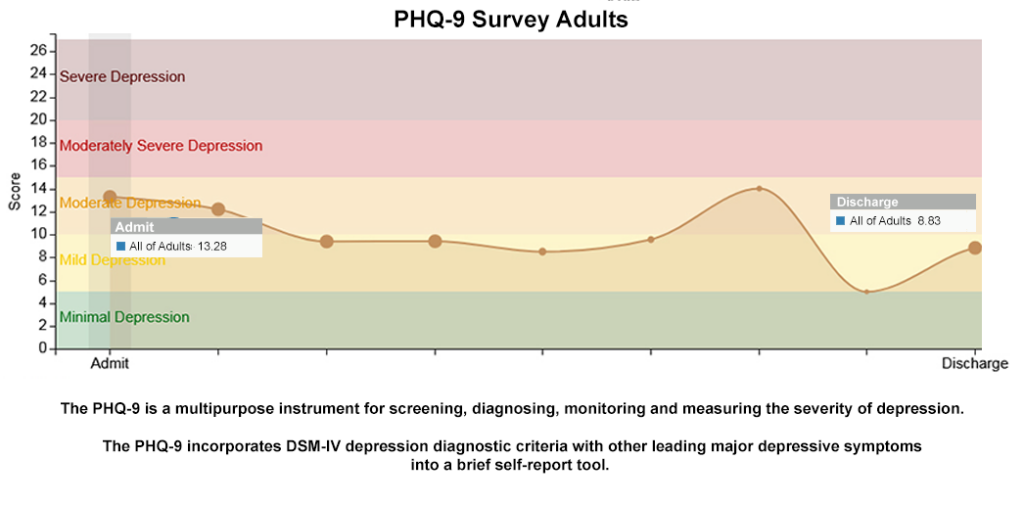
Mood Disorders: Depression Symptom Reduction (PHQ-9)
The Patient Health Questionnaire-9 (PHQ-9) is used to evaluate the severity of depressive symptoms. Scores range from 0 to 27, with higher scores indicating more severe symptoms.
Patients with Bipolar Disorder diagnosis- Admission: 14.75 (Moderate)
- Discharge: 6.11 (Mild)
- Admission: 15.31 (Moderate–Severe)
- Discharge: 8.61 (Mild)
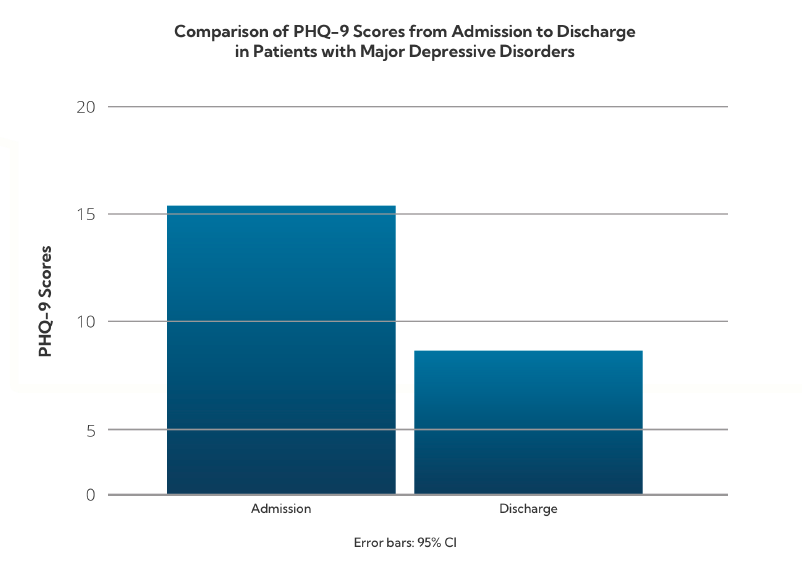
Patients with mood disorders demonstrated substantial improvement in depressive symptoms, often reducing symptom levels by more than one severity category.
Anxiety Disorders: State and Trait Anxiety (STAI-Short)
The STAI-Short measures state anxiety (temporary emotional distress) and trait anxiety (long-standing anxiety tendencies). Scores above 2.0 for STAIS and 2.8 for STAIT are considered clinically significant.
Patients with an anxiety diagnosis State Anxiety (STAIS)- Admission: 2.4
- Discharge: 1.9
- Admission: 2.8
- Discharge: 2.1

Patients with anxiety disorders showed a reduction from clinical to subclinical ranges in both short-term emotional responses and long-standing baseline anxiety patterns.
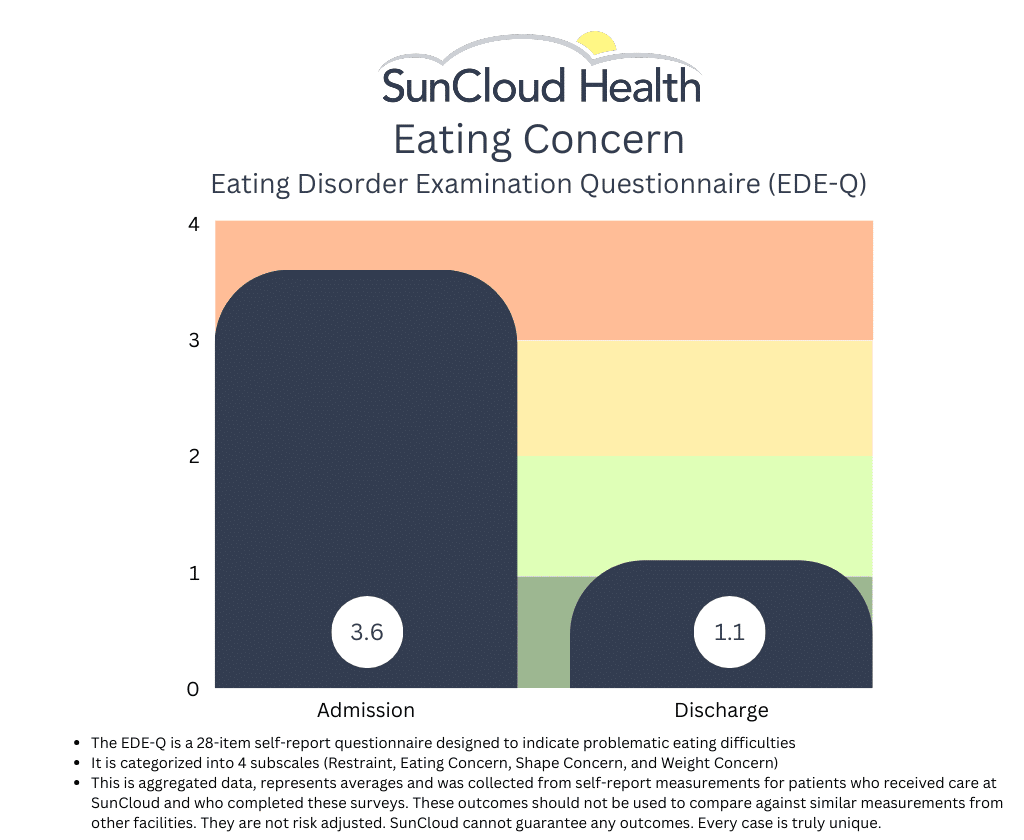
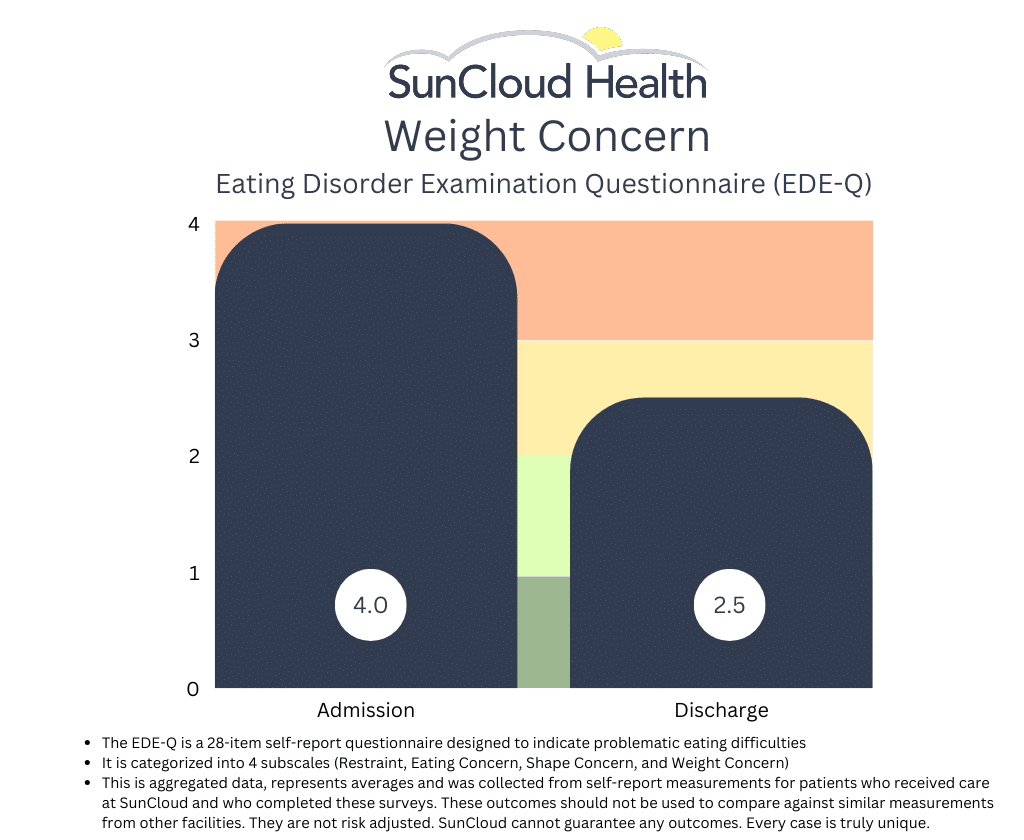
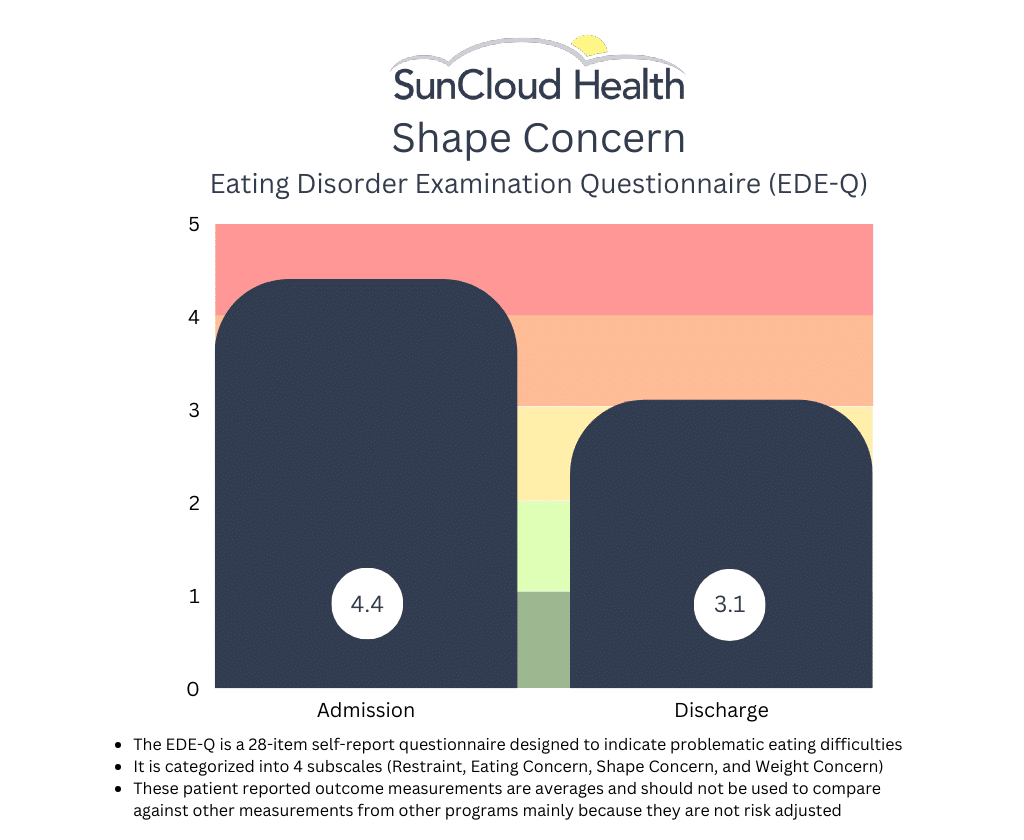
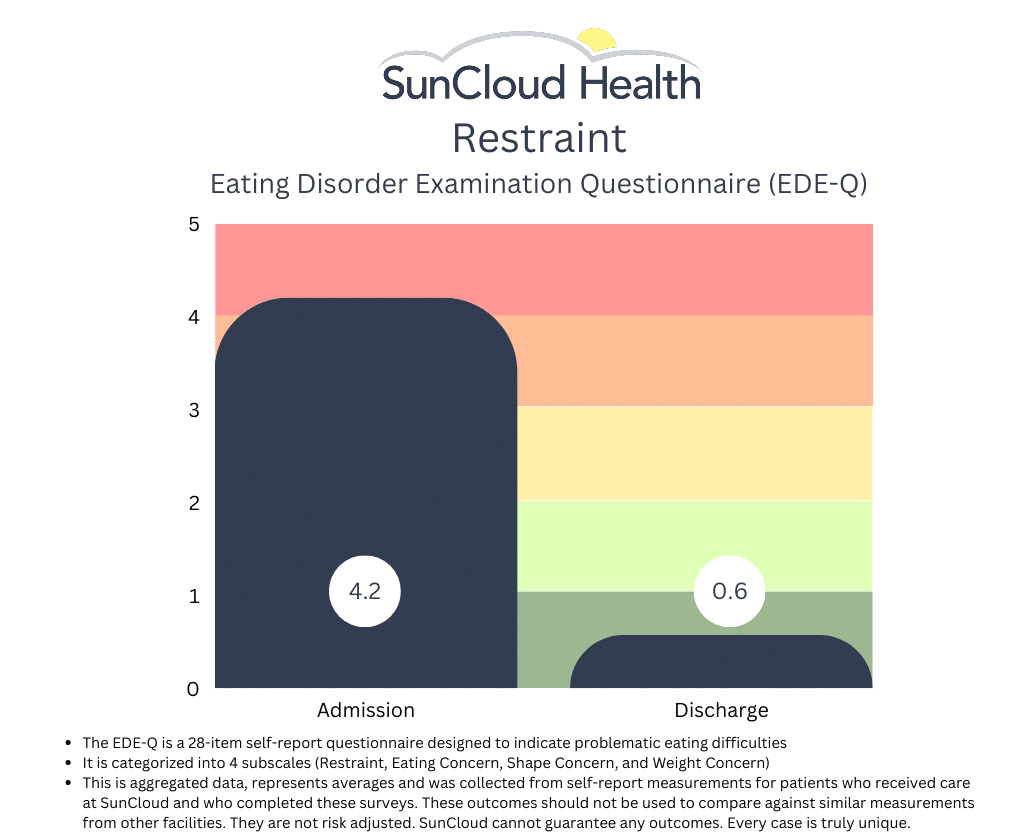
Eating Disorders: Disordered Eating Behaviors (EDE-Q)
The Eating Disorder Examination Questionnaire (EDE-Q) assesses disordered eating behaviors over the past 28 days. A score above 2.8 is considered clinically significant.
Patients with an Eating Disorder Diagnoses- Admission: 3.4
- Discharge: 2.6
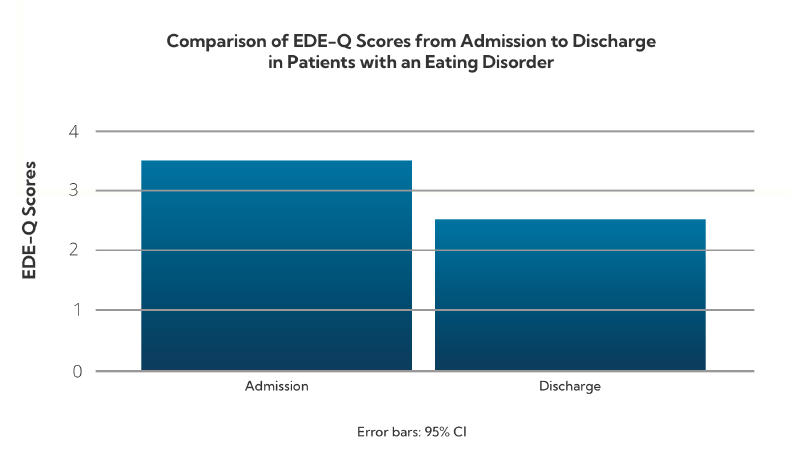
Patients with eating disorders reduced their symptoms to below the clinical threshold by discharge, suggesting strong response to treatment.
Substance Use: Alcohol Risk Behaviors (AUDIT-SR)
The Alcohol Use Disorders Identification Test (AUDIT-SR) evaluates alcohol use severity. Scores are categorized as follows:
- 1–7: Low risk
- 8–14: Hazardous use
- 15+: Alcohol dependence
- Admission: 12.8 (Hazardous use)
- Discharge: 9.56 (Reduced but still elevated)
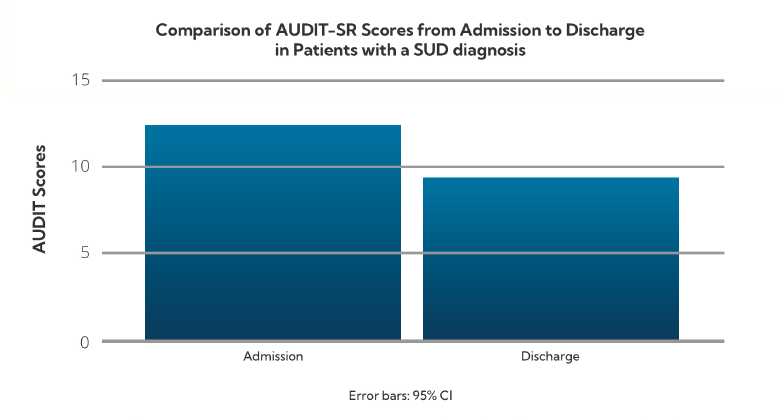
Patients with substance use issues demonstrated a significant reduction in alcohol-related risk behaviors.
PTSD: Symptom Severity (PCL-5)
The PTSD Checklist for DSM-5 (PCL-5) measures trauma symptom severity. A score of 33 or higher indicates clinical PTSD.
PTSD Diagnoses- Admission: 52.57
- Discharge: 38.9
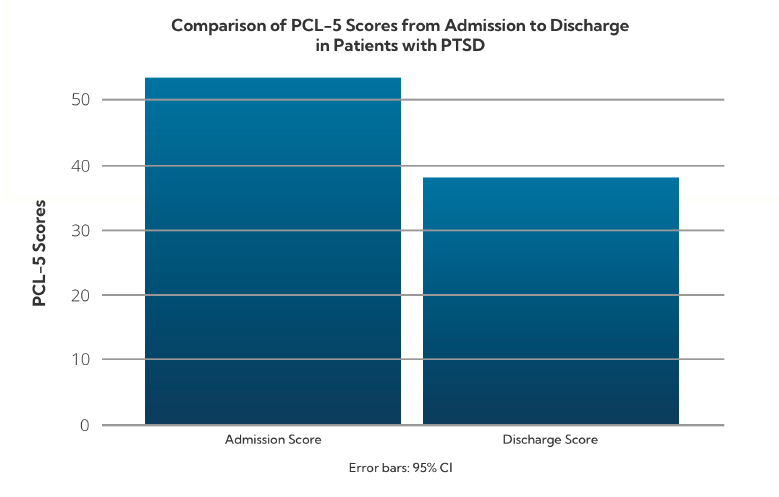
Patients with PTSD showed measurable progress and appeared to respond positively to integrated treatment where both their symptoms and underlying trauma is addressed.
Food Addiction: Compulsive Eating Behaviors (mY-FAS 2.0)
The Modified Yale Food Addiction Scale assesses symptoms of addictive-like eating behaviors.
Scoring Levels: Mild (2–3), Moderate (4–5), Severe (6+) Clients with Food Addiction- Admission: 4.0 (Moderate)
- Discharge: 2.7 (Mild)
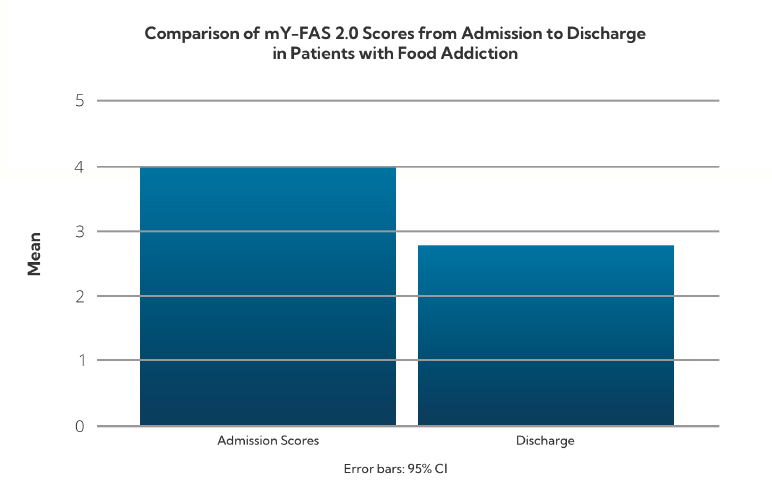
Treatment at SunCloud led to a significant drop in compulsive eating behaviors, bringing average scores below the moderate range.
Overall Wellness: Quality of Life (WHOQOL-BREF)
The WHOQOL-BREF assesses perceived quality of life across four domains: physical health, psychological well-being, social relationships, and environment.
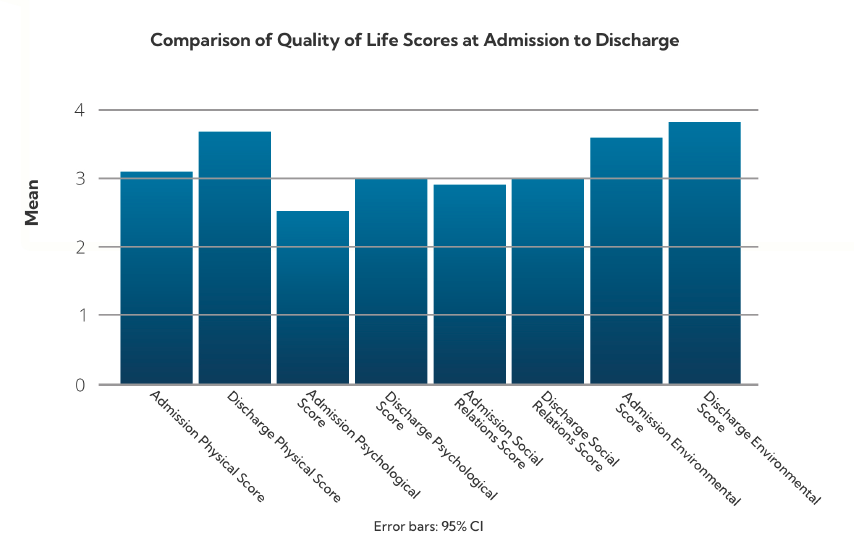
This broad-based improvement reflects enhanced day-to-day functioning and life satisfaction among SunCloud program participants.
SunCloud Health’s Patient Satisfaction Survey
The following chart summarizes results from SunCloud Health’s Patient Satisfaction Survey, collected from 1,544 participants between August 2023 and April 2025. Respondents rated their experiences across key areas of treatment, including goal-setting, autonomy, emotional safety, care quality, and overall satisfaction.
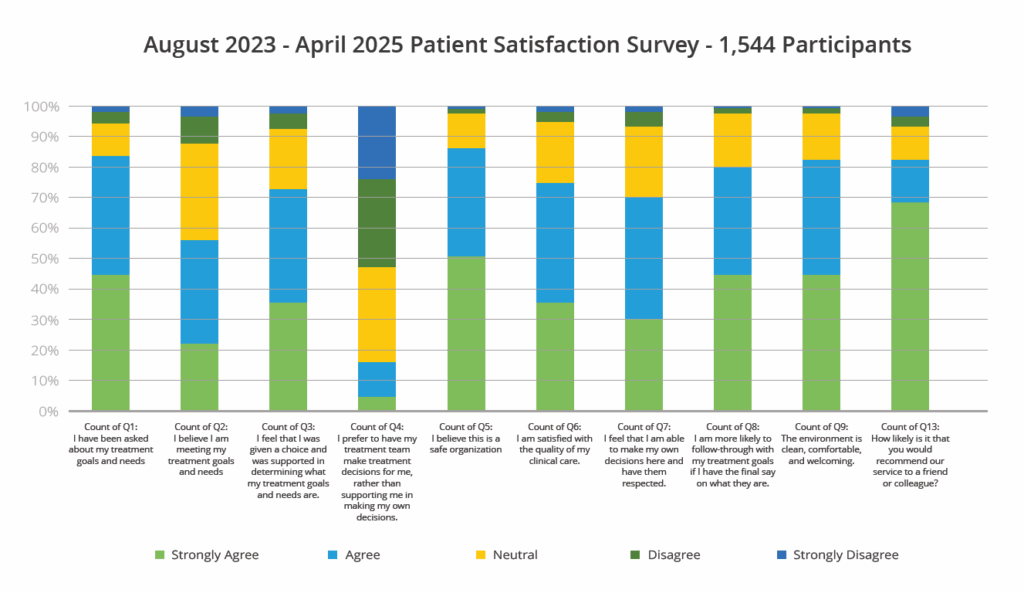
The results reflect strong levels of engagement, trust, and respect, with the majority of patients reporting positive experiences and outcomes throughout their care journey.
Conclusion
Across diagnostic groups, patients at SunCloud Health experience substantial reductions in symptom severity and meaningful improvements in emotional regulation, behavior, and overall quality of life. These outcomes support the effectiveness of our integrated, trauma-informed care model for patients with multiple diagnoses.
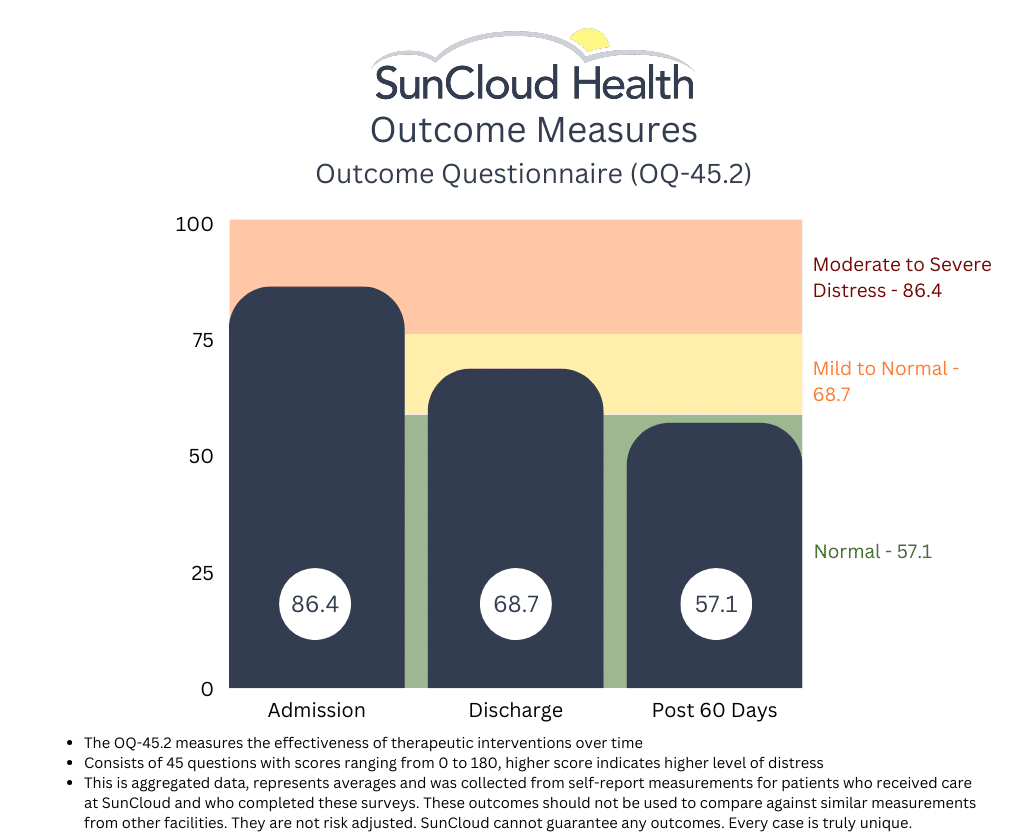
SunCloud Health’sMeasured Outcomes - 2023 - 2024
Though the field we are in has yet to identify a standardized set of outcome measurements we can all use to measure and identify “success”, this has not stopped SCH from measuring and using outcomes that we feel matter to our patients. One of the several tools we use is the OQ-45.2. This patient reported survey measures adult patient progress in therapy, and is designed to be repeatedly measured during the course of treatment, termination and at follow-up. Patient progress is measured along several important dimensions, based on Lambert’s (1983) conceptualization, suggesting that three aspects of the patient’s life be monitored:
- Subjective discomfort (intrapsychic functioning),
- Interpersonal relationships and
- Social role performance.
The OQ maintains high levels of reliability and validity, and SCH has collected thousands of these surveys since we started. Though it is far too early to publish the results of the completed study we are doing, we are pleased to report the following with the hope that if nothing else we show our ongoing commitment to the movement away from pure fee for service and toward some form of value based model where outcomes and cost drive behavior. (SIDE NOTE: If anyone reading this also treats co-occurring substance use, eating disorders, mood disorders and trauma and also uses this measurement, PLEASE LET US KNOW. We would love to share and compare results.)

From admit to discharge, we see an aggregate improvement in our adults as measured by the PHQ-9. Lower scores reflect an improvement.

Treatment Outcomes – January 2020
Detailed in this report are the client characteristics and treatment outcomes for over 289 patients who have received services since 2018.
The purpose of this document is to examine the impact of treatment. It can serve as a tool to offer accountability to SunCloud’s clients, staff, and other stakeholders – it offers understanding of whether clients change, by how much, and what might foster that change. It can also be used to celebrate successes and examine areas for professional development and continuous quality improvement.
Overall, the evaluation tells us that SunCloud treatment helps clients reduce their mental health symptoms between admission and discharge. Specifically, on areas of Symptom Distress such as Depression and Anxiety, clients who attend SunCloud experience significant improvements over the course of treatment.
View the Results
Outcome Questionnaire 45.2 (OQ45.2). The OQ45.2 is the treatment outcome indicator for this evaluation. It is a 45-item instrument with three sub-scales: Symptom Distress, which assesses internalizing issues such as depression and anxiety, Interpersonal Relations is a proxy for social relationships, and Social Role assesses compliance with the law and other social behavior. The OQ Total Score and each of the subscales have clinical indicator benchmarks to indicate the point above which can be considered clinically problematic and each has a known ‘reliable change index (RCI)’ for ease in understanding whether therapeutic change is significant. The Total score and all sub-scales have good validity, test-retest reliability (.78-.84), internal consistency (.74-.93).
At admission, average scores on all OQ sub-scales and on the Total score were above the clinical benchmark, indicating clinically problematic functioning. The amount of change on all OQ scores was significant, and exceeded the RCI on Symptom Distress and Total Score.
Table 2. Average OQ Total and Sub-Scale Scores for All SunCloud Clients Pre-to Post-Treatment

To view the complete results of this study and our methodology, the full report can be found here.
Treatment Outcomes – January 2019
The primary metric evaluated is improvement per day as measured in average daily drop in OQ-45.2 scores between admission and discharge. Current patients were omitted and sub-scales were not analyzed. Results are all statistically significant using p<.01.
View the Results
1. The mean OQ 45 improvement per day is statistically significant and equal to 0.444 points/day or 3.11/week. (n=106, p<.001)
2. Patients with higher (worse) scores on intake improve faster.

3. Predicted weekly improvement rates for a particular patient vary widely. As we add more independent variables to the study, we hope to be able to explain this.
4. Patient age does not have any significant relationship with improvement.
5. Controlling for intake score, the longer a patient is in treatment, the worse the improvement rate.
The average time in treatment for patients who have been discharged with two or more tests is about 66 days. The expected rate of improvement after 66 days is still, however, positive and statistically significant.

This report was produced with the much needed help of Brett A. Saranati, Ph.D. Brett is currently a Visiting Professor at Kellogg School of Management at Northwestern University and a Lecturer at Stanford University. Brett’s primary fields of specialization include business statistics, game theory, managerial economics and competitive strategy.
From admit to discharge, we see an aggregate improvement in our adolescents as measured by the PHQ-9. Lower scores reflect an improvement.
Collecting Outcomes
We here at SunCloud Health are thrilled to announce that after two years of hard and persistent work, we are very close to being in a position to release the first results of our patient reported outcome measurements!
Built in to our DNA is appreciating the immense value this data provides to us, our patients, their families and our payers- and then figuring out what to do with it.
Seeking to be a pioneer in value based delivery of behavioral healthcare we are inspired by internationally respected healthcare thought leaders such as Michael E Porter, Thomas H Lee, MD and Leemore Dafny.
We aspire to be like hospital systems such as The Cleveland Clinic and Germany’s Schoen Clinic who have already proven that a focus on value over volume is not only good for patients but it is good for business.
Currently we using the data we are collecting to influence our ongoing clinical care, providing our clinical team with patient reported information on outcomes that matter to our patients.
Our outcomes are incorporated in real time into the process of care, allowing us to track progress and make clinically appropriate changes as we interact with our patients. We can see where and when patients report they are improving (or not) and compare that to clinical observations. We are able to use this data when justifying level of care recommendations both to our patients and their payers. We use the data to see where our patients feel we can improve, and where they feel we may be excelling. We can drill down in to an individual patient’s results and we can see average trend lines among all of our patients. We collect data on admit, weekly during treatment, at discharge and then post discharge.
Admittedly post discharge collection remains our biggest challenge, and this will likely always remain the case. Not yet are we able to compare ourselves to other providers in our field, but we are one of the few who hope this is coming- and for our patients sake, the sooner the better.
We look forward to sharing our process and our results in an honest, transparent and meaningful way in the very near future.
We hope this will be an inspiration to all providers as we all seek a common goal of improving quality and reducing cost.
Although the process of collecting, using and sharing data like this can be time consuming and might appear at first to be Daunting, in the end doing so is ultimately in the best interest of our patients- and that is really what matters most.
Outcomes need to be standardized and risk adjusted in order to mean much. Patients beware!
We should all be thrilled to see that a few providers are beginning to publish health outcomes for mental health and addiction treatment. We see them on websites showcasing patients progress and occasionally we see them presented at industry conferences by providers advertising their successes. We use outcomes in healthcare as one way of measuring the quality of care we are providing for our patients, their families, and their payers. Only once we have outcomes can we then take the next crucial step of measuring value for our patients and their families where value is a function of outcomes that matter to patients per dollar spent. Once we are finally able to measure value can we then make the badly needed transition to a system that is centered around quality instead of solely quantity (aka fee for service). This transition has proven in many other areas of medicine at major health institutions to align the interests of patient, provider and payer and results in improved quality at a lower cost.
In mental health and addiction treatment the outcomes that matter to our patients are often difficult to measure. If our job is to mend a broken bone, we x ray the bone a few months post-surgery and it has either healed or it has not healed. In our field, it’s not so easy… We want to know if our patient’s overall mood has improved, if they are able to engage in healthy relationships, if they feel satisfied with their employment situation, if they are feeling less alienated and more connected in their community, if their eating habits and their relationship with food and their bodies are healthy and if they have been sober… In order to assess much of this type of information we use validated patient reported outcome measurement tools such as the PHQ-8 or 9, the EDEQ (Eating Disorder Questionnaire), the ASI-LITE (Addiction Severity Index), the OQ-45.2 and many of us use a patient satisfaction survey. These measurements tools are not perfect, but they have proven to be statistically and clinically reliable. Many of us who are collecting this data wisely use it to measure ourselves. Where we see internal deficiencies, we try and improve. If nothing else the data collected serves as one additional piece of information, we can use to support our patients.
Externally, those of us confident in the quality of care that we are providing want to transparently provide outcomes to prospective patients, their families and their payers as they assess where to go for help (and why). To be useful, however, these outcomes must be standardized, and they must be risk adjusted. Standardization means we are all using (and publishing) the same tools for the same patients in the same way at the same time. If we are using the EDE-Q and our friends across the street are using the EAT-26 (another tool used to measure eating disorder progress), for instance, the two cannot be compared against one another and therefore any comparative analysis is useless. Agreeing on which tools to use is a process that we hope will happen soon. Once we all agree, however, this is fairly straight forward.
Risk adjustment is a bit more complicated and yet as if not more important. Risk adjustment takes into consideration the underlying health status of the patient being measured. The more complicated the patient’s condition, the “riskier” they are and therefore the more resources will be needed to treat them effectively. Further, the more complicated the patient, generally the less improvement we might expect to see or at the very least the improvement in a complex patient will look different. Without both standardization and risk adjustment to outcome results, we simply have no way to determine how well patients at a facility are improving as compared to similar patients at another facility. Yet this is critical if any value is to be placed in reviewing any one provider’s results.
For example, take the example of an addiction treatment facility which publishes abstinence rates showing that 80% of its discharged patients remain abstinent at 365 days post treatment; Or Look at a treatment center that treats depression which publishes a decrease from 14 to 9 from admission to discharge in their PHQ-8; Or, consider the results published by a treatment center that treats eating disorders where they show a decrease from 4 to 2 in their EDE-Q from admit to discharge while the non-clinical person measures a score of 1.4. On the surface these results appear to show that treatment in these respective programs works. This is all very good news and probably true to some degree. However, if we want to know whether these results are good, bad or average as compared to other programs treating similar patients, on their own in the vacuum in which they are presented these scores fail miserably in this effort.
First, we must ensure that what we are measuring is precisely what others are measuring and then doing so the same way at the same time (ie. weekly in treatment, 30 days post treatment, etc). Using the abstinence measure example above, for example, if the definition of abstinence is not clearly defined the same way across all providers measuring it, then no fair comparison can be done. Does it mean no use since discharge, no use in the past 30 days, past 2 days??? If one provider is asking the question via email and the other is asking it in person, it’s probably not all that useful to assume the results can accurately be compared. Standardization is critical. Such is the case in all data analyses.
As for risk adjustment, imagine if the addiction facility that publishes the 80% abstinence rate at 360 days post discharge generally treats patients who have never been in treatment before, are relatively young, have not struggled with the disease for a long time and who do not have any co-occurring depression, anxiety, or trauma…the 80% score might look fantastic but what if another provider uses the same tool, measures the same way and yet shows a 60% abstinence rate? However, when looking more deeply at this provider using some form of risk adjustment model), we see their patients are significantly more complex in that they are generally older, have in many cases been in and out of treatment for much of their lives and have co-occurring trauma, depression, and anxiety along with a host of medical co morbidities. Would we say this provider is producing lower quality work because their abstinence rate is 60% as compared to 80%? Probably we would not. In fact, we might say the opposite; namely, that the first provider could possibly be doing better.
The same would be said for the other two examples above. I have seen one published report that shows patients improve from a 14 to an 8 using the PHQ-8 scale and another report whose patients improve from an 11 to a 2! If the latter is telling the truth, undoubtedly their patients are far less complex and acute than the former. Either that or they have some proprietary miracle intervention they are using in which case I suspect we would all know about it by now… Thus, the two results are likely not comparable and yet if not scrutinized a potential patient might assume the latter provider is a better fit for them! If a facility that treats depression for example sees mostly relatively mild cases of depression and their “success rate” is say 80%, does that mean they are doing far better work than the facility that specializes in treatment resistant depression where patients have generally had at least one suicide attempt and whose “success rate” is 20%? The answer is no. Without any sort of risk adjustment on the acuity and complexity of patients being measured, we really have no idea what we are looking at when trying to compare results between multiple providers.
One clear example is in looking at the survival rate (an outcome) of stage 1 lung cancer versus the survival rate of stage 4 lung cancer. With stage one the survival rate is anywhere between 70-90% whereas with stage 4, it’s around 10%. If we were considering Mayo and Cleveland Clinic for our cancer care, we would likely ask them what their survival rates are not just for any cancer but specifically for the stage and type of cancer that we might have. The same analysis cannot be done without risk adjustment and standardization in addiction and mental health treatment and yet without it these outcome measurements don’t mean much.
As mentioned above, standardization is the easy part. We simply need to agree on a universally accepted set of measurement tools for the conditions we treat and then collect them the same way. Easier said than done but still relatively simple once we agree to do it. The risk adjustment part is more difficult. These diseases are often difficult to diagnose and “stage”. It takes time to get to know our patients and as time passes, we often see that there is far more than what met the eye initially at the time of the evaluation. Still, we can start with something and some of the ways we risk adjust at SunCloud are by using the following.
- Level of care patient is coming from previously? Coming from inpatient, higher risk. Coming from outpatient, lower risk.
- How many diagnoses does the patient have? The more they have, the higher risk they are.
- Has the patient been hospitalized for their addiction/mental health issue in the past 5 years?
- Does the patient have a supportive family?
- Are their medical comorbidities at this time as a result of the patient’s condition?
- Any history of overdose or suicide attempt?
Once we finally have standardization and eventually some form of risk adjustment model, the outcomes some of us collect will be far more valuable to patients, their families, and their patients. Meantime some data is undoubtedly better than no data and those of us collecting it and publishing it should be commended. We just advise everyone to take all of it with a grain of salt. At least for now.
Read more from David Newton, SunCloud Health’s Director of Operations, on today’s issues in behavioral health, about the need for accountability, transparency and outcomes in behavioral health.
SCH is thrilled to announce that it has agreed in principle to enter in to its first “value based” contract with a major payer
This agreement, with one of the country’s largest private insurance companies, holds us accountable for providing certain tasks which we know improve outcomes (aka results) for our patients and their families. It rewards us when our patients do better and in some ways penalizes us when they do not. It requires us to be far more transparent with what we do (and don’t do!), which we embrace passionately and enthusiastically.
Though the program lacks certain characteristics of an ideal “value based program” such as true bundled payments (which forces bundled/coordinated care designed around our patients conditions) and appropriate risk adjustments, it is indeed a step in the right direction! David Newton, Director of Operations for SCH, says of the program, “We are so grateful for this opportunity to be a part of the future of all healthcare, which is finally embracing behavioral health.
Increasing value for our patients by improving outcomes that matter to our patients while at the same time reducing cost is built in to our DNA. When our patients do well, we should do well. And when they don’t do as well, when appropriate we should be held accountable for our provision of care.
This is how the rest of the world operates…Why should healthcare be so different? It shouldn’t be. We are thrilled to be a part of this journey and we look forward to sharing more as we implement the program”.
Dr. Lauren Pace, DO and Psychiatrist on the benefits transparency
Explaining SunCloud’s Integrated Model Why is an integrated treatment model essential to successfully treating patients?
Dr. Kim Dennis, Co-Founder and Medical Director at SunCloud Health, discusses the vital role the integrated model (that she is pioneering at SunCloud Health) plays in the success of treating patients with co-occurring disorders and underlying trauma. How does SunCloud create an authentic culture of patient support?